
What Is a Median Home Price?
- Published on
- 8 min read
-
 Richard Haddad Executive EditorClose
 Richard Haddad Executive Editor
Richard Haddad is the executive editor of HomeLight.com. He works with an experienced content team that oversees the company’s blog featuring in-depth articles about the home buying and selling process, homeownership news, home care and design tips, and related real estate trends. Previously, he served as an editor and content producer for World Company, Gannett, and Western News & Info, where he also served as news director and director of internet operations.
The median home price is a key metric used to understand housing trends at the national, state, and local levels. This market metronome has gained considerable attention in recent years as home prices have increased by as much as 50% since 2019.
In this easy-scan, illustrated guide, we’ll explain what the median home price represents and how it’s used. We’ll also look back at how it’s changed and provide a tool for sellers to estimate home sale proceeds.
How Much Is Your Home Worth Now?
Home values have rapidly increased in recent years. How much is your current home worth now? Get a ballpark estimate from HomeLight’s free Home Value Estimator.
What is the median home price metric?
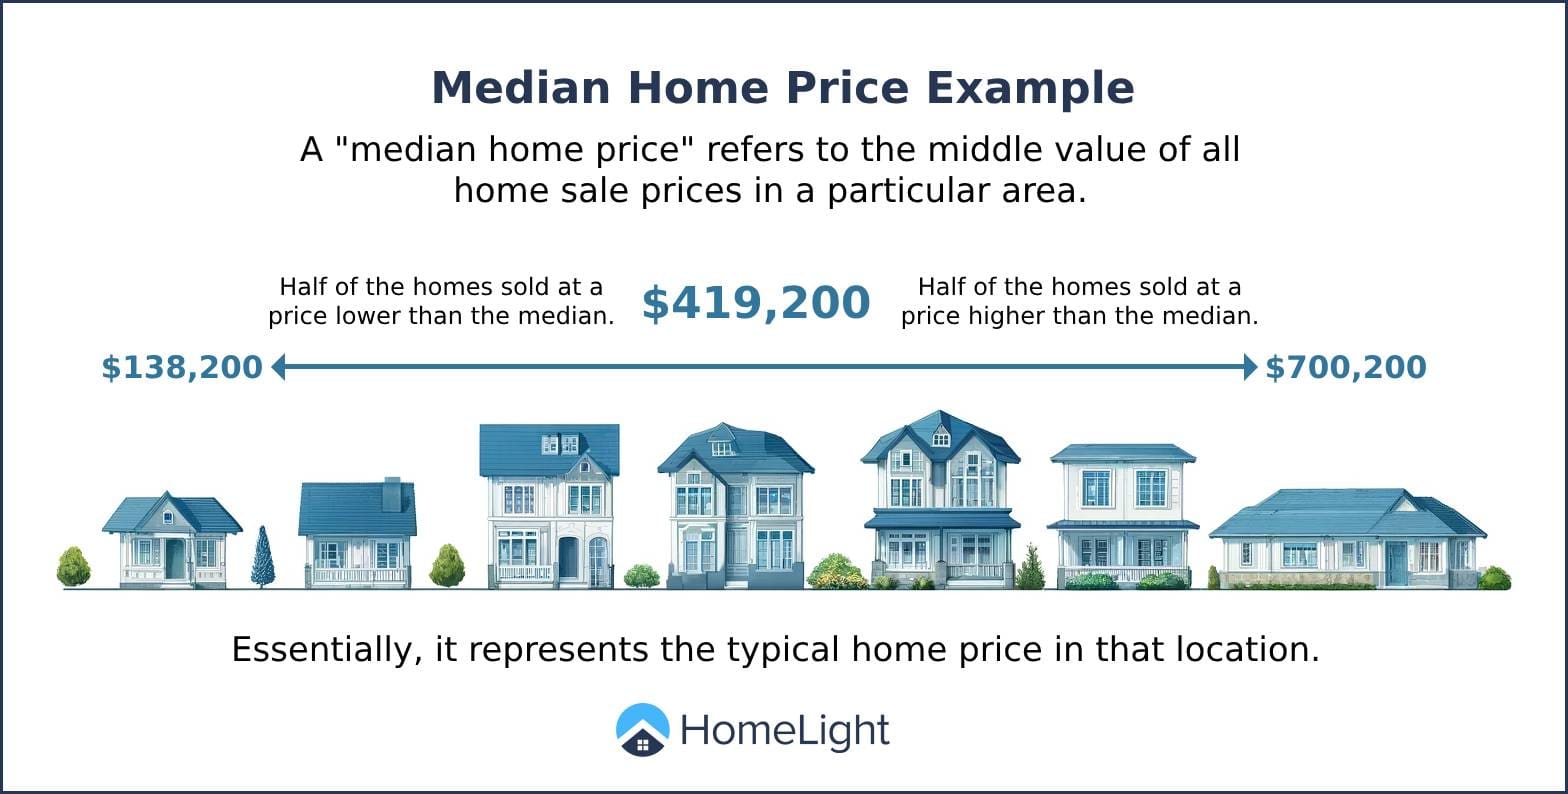
The median home price is the middle price of all homes sold in a specific area during a given time period. In other words, if you lined up all the sold homes from least expensive to most expensive, the median would be the one right in the middle.
This differs from the average home price, which is calculated by adding up all sale prices and dividing by the number of homes sold. The median is often considered a more reliable indicator because it isn’t skewed by a few extremely high or low sales.
For example, if 101 homes sell in a city over a month, the median price is the sale price of the 51st home on the list — not the mathematical average of all 101 sales.
What is the U.S. median home price?
The median home price in the U.S., based on the most recent data, is $419,200. This number gives a snapshot of home values nationwide, but it can vary widely by region, city, and even neighborhood.
If you’re considering selling or just curious about area trends, looking at your local median home price is far more relevant than the national figure. A home in a high-cost market like San Francisco will naturally have a much higher median than one in a more affordable area.
Below are current median home sale prices in some key metro markets throughout the country:
- Los Angeles-Long Beach-Glendale: $939,700
- New York-Newark-Jersey City: $708,500
- Chicago-Naperville-Elgin: $369,600
- Dallas-Fort Worth-Arlington: $382,500
- Houston-The Woodlands-Sugar Land: $340,200
- Washington-Arlington-Alexandria: $623,400
- Miami-Fort Lauderdale-West Palm Beach: $635,000
- Philadelphia-Camden-Wilmington: $376,500
- Atlanta-Sandy Springs-Marietta: $374,700
- Phoenix-Mesa-Scottsdale: $476,400
- Boston-Cambridge-Newton: $735,700
- San Francisco-Oakland-Hayward: $1,315,600
Source: National Association of Realtors (existing single-family homes)
What’s the median home price where you live? You can find this information by searching the internet. The best sources are often local Realtor Associations. World Population Review maintains a map featuring median home prices in each state.
How is the median home price used?
Here are some ways the median home price metric is used by different people and industries:
- For prospective homebuyers, it provides an overview of typical price ranges in a given area, helping them gauge affordability — especially if they are moving to a completely new state.
- Home sellers can use it as a general benchmark for pricing, though they typically rely more heavily on sales data from recently sold homes.
- Lenders may use median home prices to help them determine how market trends might influence their lending decisions.
- Government agencies and policymakers use this metric to assess housing affordability, guide urban planning, and shape local housing policies.
While real estate agents may consider the median home price when listing a home, their go-to valuation tool is a comparative market analysis (CMA). This is a detailed report they create from recent sales of nearby comparable homes, known as “comps.” The median price may provide helpful insights, but a CMA will give you a far more accurate picture of your home’s market value.
Many real estate agents provide a free CMA when you book a consultation.


How has the median home price changed over time?
Like most other price tags, the median home price in the United States has been on an upward trek over the decades. In the early 1960s, the median sales price of houses was approximately $18,000. Fast-forward to the fourth quarter of 2024, and this figure has risen to $419,200. There have been a few rollercoaster years in between caused by economic, social, or political factors.

Below are some notable seasons of change we’ve seen in median home prices:
- 1970s inflation: High inflation rates led to increased home prices as construction costs soared.
- Early 1980s recession: Economic downturn and high interest rates caused a slowdown in the housing market, stabilizing or reducing median prices.
- Early 2000s housing boom: Easy access to credit, low interest rates, and speculative investments led to a rapid increase in home prices.
- 2008 financial crisis: The housing bubble burst, leading to a significant decline in home values nationwide.
- 2020s pandemic impact: A combination of low interest rates, remote work trends, and supply chain disruptions led to a sharp rise in home prices.
What makes the median home price go up or down?
Several factors influence fluctuations in the median home price:
- Supply and demand: When there’s a shortage of available homes and a lot of buyer interest, prices typically go up. On the other side of the market teetertotter, oversupply with low demand pushes prices down.
- Economic conditions: When the economy is healthy (low unemployment and rising incomes), this can home-buying power, which leads to higher prices. Conversely, a weak economy usually reduces demand and lowers prices.
- Interest rates: Lower mortgage rates make borrowing for a home more affordable, which obviously increases buyer demand — along with prices. Higher interest rates tend to slow everything down, which is what we’re seeing in the current nationwide housing market.
- Inflation: As the cost of goods goes up, so do construction costs and home prices. This is a pattern many are all too familiar with.
- Location: Desirable cities with coveted amenities, good school districts, and low crime rates often see higher median prices.
- Government policies: Tax incentives, zoning laws, and housing subsidies often impact housing supply and demand, which in turn influences prices.
Find a Top Agent With a High Sale-to-List Ratio
HomeLight can connect you with the highest-rated agents in your market. Our data shows that the top 5% of real estate agents across the U.S. sell homes for as much as 10% more than average agents.
Median sale price vs. average sale price
As noted above, the median sale price and average sale price are two different ways to measure home values. They are often confused — they are not interchangeable. Here is the difference:
- Median sale price: When all homes sold in a given period or area are arranged from lowest to highest, this is the middle price. The way it’s calculated eliminates the influence of extreme high or low numbers that can distort the overall picture.
- Average sale price: This is the sum of all home sale prices divided by the number of sales. While useful in some cases, the average price can be skewed by a few very high-priced or very low-priced homes.
For example, if 10 homes sell in a neighborhood, with prices ranging from $200,000 to $1 million, the average might be artificially high due to a few luxury sales. However, the median would provide a clearer picture of what most buyers are actually paying.
In most cases, the median sale price is a more reliable market indicator.


Get a free home value estimate
While the median home price can provide a general idea of what homes are selling for in your area, it doesn’t tell you what your home is worth. To get a preliminary estimate, you can use HomeLight’s Home Value Estimator.
This free tool analyzes recent sales of comparable homes, market conditions, and other factors to provide a near-instant online home value estimate. It’s a great starting point for sellers who are curious about their home’s potential price before listing it.
How can you estimate your home sale proceeds?
Estimating your home sale proceeds can help you when planning your next move. Your proceeds are what you’ll have left after accounting for closing costs and other expenses like agent commissions. You’ll also need to factor in your remaining mortgage balance when calculating your proceeds.
To get a rough estimate, try HomeLight’s Net Proceeds Calculator. This free tool breaks down the numbers and gives you a ballpark picture of your sale’s profit potential.
Hire a top agent for the highest proceeds
If you’re looking to sell your home and want the highest possible proceeds, work with a performance-proven real estate agent in your market. A seasoned local agent can help you accurately price your home, market it to the strongest buyers, and negotiate the best possible sale price.
Ready to get started? Use HomeLight’s free Agent Match platform to connect with a top-rated agent in your area who can help you navigate every step of the selling process — from preparations to close.
Header Source: (Pixabay / Pexels)
At HomeLight, our vision is a world where every real estate transaction is simple, certain, and satisfying. Therefore, we promote strict editorial integrity in each of our posts.
